Gower Agreement Index
E.g. if two observations differ by 5, and the measurement range of each observation is 10, then the relative discrepancy is 0.5. However, if the measurement range for each observation was say 100, then the relative discrepancy would be just 0.1.
Downloads
Installation Note
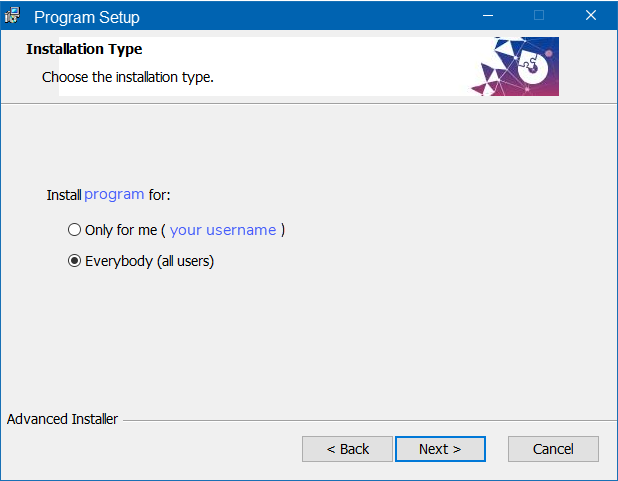
When installing the program, you will be asked whether you wish to install it for yourself (as a user), or for everyone who uses the machine.
If the machine on which you are installing this program is your own personal machine, not managed by anyone other than yourself as the de facto 'administrator', then choose:
If you try to install the program using option 2 on a machine 'managed' for you by an external IT department/administrator, and you have not been given administrator privileges yourself, then you will see a security prompt, asking you for an administrator password - which you will not possess:
In this case, exit the installation and restart it, using option 1 ("Only for me" ).
The installation creates a folder which can be used for storing output graphics and tables ... c:\users\public\Gower Input-Data. The first time you attempt to save any results, it automatically opens that subdirectory for you. From then on, should you choose any other preferred folder, the program remembers the last used path. Relative to the maximum possible absolute (unsigned) discrepancy between the two pairs of observations, the gower discrepancy coefficient indicates the % average absolute discrepancy between all pairs of observations. When expressed as a similarity coefficient (by subtracting it from 1), it indicates the % average similarity between all pairs of observations.
If you change the value of that maximum possible discrepancy, then the Gower coefficient will change to reflect this, as the discrepancies between pairs of observations are divided (scaled) by that maximum possible discrepancy value.
But that's the whole point of the Gower, it tells you how discrepant (or similar) observations are, RELATIVE to how discrepant they could have been. A 5-point difference in a 10-point maximum measurement range is not very good. A 5-point difference between observations within a 100-point measurement range is pretty accurate.
The program only works with two columns of numbers - providing 7 coefficients computed from such 'bivariate" data. If you need a matrix of such values, for each of these coefficients, you would need to use the IRR-1 program (available whenever I can find some time!).
It takes data from an Excel file as input (.xlsx or .xls), displaying the data and calculation results in two Excel-style grids, which can be printed or copied through the clipboard into Excel
It also displays a scatterplot of the data as well as a case-order plot. The latter plot is for the kinds of data which are ordered sequentially; for example where two variables or attributes are sampled over sequential time-points.
If you want a significance test for the Gower, use my Gower Bootstrap program. This computes the empirical sampling distribution for a Gower coefficient, taking into account the maximum possible discrepancy range, the kind of data (integer or reals) and the number of observations over which a Gower has been computed. It also allows you to test the significance of a difference between two Gower coefficients, by constructing the empirical sampling distribution of the difference between two Gower coefficients given their respective data characteristics (sample size, number type, and maximum possible discrepancy of observations in each sample).
It's an interesting coefficient - useful when combined with a measure of monotonicity, the Pearson Correlation.


1. "Only for me"
However, if the machine is managed by an 'external' administrator (e.g. your employer's IT or university IT dept.), then choose:
2. "Everybody (all users)"
